


1. INTRODUCTION
2. METHODS
2.1. IEQ Survey System
2.2. Questionnaire and participants
3. RESULTS AND DISCUSSION
3.1. IEQ analysis in overall research complex
3.2. IEQ Analysis in Each Building
3.3. Visualization
4. CONCLUSION
APPENDIX
1. INTRODUCTION
In developed countries, individuals spend approximately 90% of their time indoors, highlighting the significance of building components in creating satisfying environments (Klepeis et al., 2001). The scientific community has increasingly focused on Indoor Environmental Quality (IEQ), evaluating key factors like thermal comfort, visual comfort, acoustic quality, and indoor air quality based on European Standard EN 16798-1 and International Standard ISO 10551 (Frontczak & Wargocki, 2011; Khovalyg et al., 2020). Studies have shown that indoor environmental conditions significantly affect cognitive function (Allen et al., 2016), work performance (Lamb & Kwok, 2016), and occupant well-being (Al-Horr et al., 2016; Belussi et al., 2019). Recent research has emphasized the critical relationship between these environmental factors and workplace productivity (Wang et al., 2021). The development of sophisticated assessment tools like BOSSA (Candido, Kim, de Dear, & Thomas, 2019) has enabled more comprehensive post-occupancy evaluations, while studies incorporating Office Layout in IEQ perceptions (Parkinson, Schiavon, Kim, & Betti, 2023) have expanded our understanding of workplace environmental quality. Furthermore, the integration of advanced monitoring systems has enhanced our ability to evaluate and optimize indoor environments in real-time (Tsang, Mui, Wong, Chan, & Chan, 2024).
This study extends the scope of indoor environmental research beyond traditional office and residential buildings by examining a research complex through a novel location-based approach (Lee, Kim, Lee, & Jeong, 2020). Our methodology incorporates spatial information and GIS technologies (Wang, Pan, & Luo, 2019) for evaluating IEQ factors, with particular attention to the unique requirements of research facilities as demonstrated through recent comparative field studies (Lee, Lee, Lee, Jeong, & Lee, 2022). The integration of three-dimensional visualization capabilities and advanced digital technologies (Uhlhorn, Geißler, & Jiricka-Pürrer, 2024) enables a more comprehensive understanding of spatial variations in environmental quality. Uniquely, the study proposes a method to determine the weighting of each environmental factor within the entire complex, followed by a comparative analysis across different buildings. This methodological approach enables not only the identification of overarching factors affecting IEQ but also pinpoints building-specific elements critical for environmental optimization. The results from this comprehensive analysis will provide valuable insights for developing targeted strategies to enhance individual building performance within a research complex, marking a significant departure from the generalities often seen in existing literature. Our findings contribute to the growing body of research on IEQ improvement and offer practical guidelines for facility managers and building designers.
2. METHODS
2.1. IEQ Survey System
This study highlights the evolution of IEQ research through the development of a novel survey system that integrates location-based technologies with comprehensive environmental assessment capabilities. In particular, while web-based occupant satisfaction surveys have been effectively developed in the United States and United Kingdom, the current state of IEQ data collection in Korea has been fragmented and infrequent (Lee et al., 2020; Lee, Kim, Lee, & Jeong, 2021).
The survey system was developed using WordPress as the foundational platform, enhanced with custom plugins to enable sophisticated survey design and distribution. A key innovation is the integration of Location-Based Services (LBS) and Geographic Information System (GIS) technologies for real-time, context-specific IEQ data gathering (Chuang et al., 2016; Liu, Li, Chen, Luo, & Zhang, 2019; Zhang, Mo, & Huang, 2010). The system implements a map-based address lookup functionality that links responses to a building’s physical and geographical context.
Our approach leverages three-dimensional visualization capabilities through the Indoor3D API, allowing for comprehensive interior mapping and detailed internal representations of buildings. The integration with the Indoor3D API enables a robust approach to analyze and visualize IEQ data in relation to spatial parameters. The system employs a color-coded feedback mechanism for visual representation of user input, especially regarding occupant satisfaction. This mechanism uses a spectrum of colors—red, yellow, and green—to symbolize different satisfaction levels, providing intuitive visual cues for easy data interpretation. This approach enables administrators and researchers to quickly identify areas needing attention, neutral conditions, and satisfactory aspects within the building, thus enhancing the efficiency of data analysis and decision-making processes based on occupant feedback.
2.2. Questionnaire and participants
In this research, we have developed a sophisticated survey instrument for IEQ, incorporating revised items from the Center for the Built Environment (CBE). This comprehensive survey covers foundational information about buildings and respondents’ workspace locations, extending to five core IEQ areas: office layout, thermal comfort, air quality, lighting environment, and acoustic environment, along with overall comfort and productivity. Specifically, office layout consists of amount of space, visual privacy, ease of interaction; thermal comfort consists of temperature level, relative humidity level; air quality consists of stuffiness & freshness, odor; lighting consists of artificial lighting level, natural lighting level, visual comfort; and acoustic quality consists of noise level and sound privacy.
A comprehensive survey was conducted within a distinct Korean research complex, composed of 26 buildings. The complex’s location, characterized by low population density and fewer neighboring structures, was strategically chosen. Detailed information about the complex, including floor count and total area, was seamlessly integrated using building register data and spatial information like GIS maps and building polygons. Responses were received from 16 buildings, with a critical decision to exclude those with response rates below 50% to maintain the study’s validity and representativeness. This threshold ensured the inclusion of perspectives from a significant segment of the buildings’ occupants, focusing the analysis on the most representative buildings. Table 1 provides essential descriptive statistics of the survey, laying the groundwork for an in-depth analysis of the occupants’ experiences and perceptions within these research buildings.
Table 1.
Frequency analysis
3. RESULTS AND DISCUSSION
3.1. IEQ analysis in overall research complex
A multiple regression analysis was conducted using IEQ satisfaction surveys from 275 occupants across various buildings. The analysis aimed to ascertain the impact of factors like office layout, thermal comfort, air quality, lighting, and acoustic quality on overall satisfaction. To execute this analysis, mean values of aggregated variables were computed for each factor. The calculation of mean values using aggregated variables was performed as follows: First, individual responses to sub-items within each IEQ factor were converted to numerical values (1-7 scale). For example, within office layout, values for ‘amount of space,’ ‘visual privacy,’ and ‘ease of interaction’ were collected from each respondent. Second, these values were summed and divided by the number of sub-items to obtain a mean score for each IEQ factor for each respondent. Third, these individual mean scores were then used as independent variables in the regression analysis, with ‘overall comfort’ as the dependent variable. This approach ensures that each IEQ factor is represented by a composite score that reflects its multi-dimensional nature. This systematic approach to regression analysis follows established methodologies for evaluating workplace environmental quality (Candido et al., 2019; Wang et al., 2021).
As shown in Table 2, the analysis reveals each variable’s substantial statistical significance (p-values < 0.001), affirming their marked impact on “overall comfort.” Office layout emerges as the primary factor (45.86%), followed by acoustic quality (26.87%), thermal comfort (22%), air quality (20.33%), and lighting (13%). This finding aligns with recent studies highlighting the critical role of spatial configuration in research environments (Lee et al., 2022). The regression model’s efficacy, gauged through the Root Mean Square Error (RMSE) of 0.6465 and an R-squared (R²) of 0.7755, indicates that about 77.55% of the variance in “overall comfort” is explained by these factors, underscoring a robust model fit and significance. In addition, a regression analysis was conducted to examine the relationship between ‘overall comfort’ and ‘productivity’, with the former as the independent variable and the latter as the dependent variable. This analysis builds on previous research examining the links between environmental quality and workplace performance (Lamb and Kwok, 2016).
Table 2.
Frequency analysis
| Variable | Coefficient | Standard Error | F-statistic | t-value | p-value |
| Office layout | 0.4586 | 0.043 | 405.48 | 10.6722 | *** |
| Thermal comfort | 0.22 | 0.0345 | 105.57 | 6.3728 | *** |
| Air quality | 0.2033 | 0.0381 | 156.71 | 5.343 | *** |
| Lighting | 0.13 | 0.0514 | 190.91 | 2.5276 | *** |
| Acoustic quality | 0.2687 | 0.0372 | 178.96 | 7.219 | *** |
The results of this regression, after transforming ‘productivity’ into numerical values, are comprehensively detailed in Table 3, providing empirical insights into the correlation between these two critical variables. Here, the p-value for ‘overall comfort’ indicates high statistical significance. RMSE was 0.6652. The R-squared value of 0.7668 indicates that approximately 76.68% of the variance in ‘productivity’ is explained by the model. The coefficient represents the expected change in the dependent variable (“productivity”) for a one-unit change in the independent variable (“overall comfort”), holding other variables constant, and shows a result of 88.41%.
3.2. IEQ Analysis in Each Building
After establishing overall IEQ factors for the research complex, we conducted detailed analyses for individual buildings. From the sixteen buildings surveyed, after applying a minimum response rate criterion of 50% to ensure data reliability and representativeness, six buildings were selected for detailed analysis. We performed multiple regression analyses for these buildings to identify key factors influencing IEQ satisfaction and their impact on productivity. This methodological approach, focusing on buildings with high response rates (ranging from 51.2% to 78.9%), ensures robust statistical analysis while maintaining data quality (Candido et al., 2019; Lee et al., 2022).
As shown in Table 4, the analysis reveals varying patterns of environmental influence across different buildings. In Building #1, office layout shows the strongest impact (coefficient = 0.602201, p < 0.001), followed by significant influences from acoustic quality and thermal comfort. Building #25 demonstrates different priorities, with air quality emerging as the primary factor (coefficient = 0.384152, p < 0.05), accompanied by notable effects from acoustic quality and thermal comfort. These variations align with recent findings regarding the context-specific nature of environmental satisfaction in research facilities (Wang et al., 2021).
Table 4.
Overall Methodological Quality of Measurement Properties
| Building Name | Variable | Coefficient | Standard Error | t-value | p-value |
| #1 | Office layout | 0.602201 | 0.080212 | 7.507629 | *** |
| Thermal comfort | 0.168192 | 0.054502 | 3.085947 | ** | |
| Acoustic quality | 0.332823 | 0.065901 | 5.050365 | *** | |
| #25 | Thermal comfort | 0.254364 | 0.110542 | 2.301061 | * |
| Air quality | 0.384152 | 0.14334 | 2.68001 | * | |
| Acoustic quality | 0.286758 | 0.118698 | 2.415862 | * | |
| #2 | Office layout | 0.233041 | 0.099014 | 2.35363 | * |
| Air quality | 0.435158 | 0.13943 | 3.120987 | ** | |
| #20 | Acoustic quality | 0.248269 | 0.079047 | 3.1408 | ** |
| Office layout | 0.589867 | 0.126997 | 4.644728 | *** | |
| #15,15-1 | Office layout | 0.4857 | 0.125053 | 3.883952 | *** |
| Thermal comfort | 0.239059 | 0.111388 | 2.146175 | * | |
| Acoustic quality | 0.425281 | 0.112581 | 3.77756 | ** | |
| #26 | Office layout | 0.461603 | 0.1388 | 3.325673 | ** |
| Thermal comfort | 0.434048 | 0.103679 | 4.186461 | *** | |
| Air quality | 0.204318 | 0.095542 | 2.13853 | * |
Table 5.
Regression analysis
| Building Name | Coefficient | R-squared |
| #1 | 0.917517 | 0.767766 |
| #25 | 0.919626 | 0.831721 |
| #2 | 0.872869 | 0.622248 |
| #20 | 0.88756 | 0.851415 |
| #15, 15-1 | 0.934783 | 0.837409 |
| #26 | 0.853211 | 0.687994 |
The regression analysis depicted in Table 5 across six buildings showcases a range of coefficients from 0.872869 to 0.934783, indicating a strong positive relationship between workspace satisfaction (“overall comfort”) and “productivity.” The R-squared values, varying from 0.622248 to 0.851415, suggest that satisfaction levels significantly account for variations in productivity, although the degree of this impact differs across building environments (Candido et al., 2019). Building #15,15-1 shows the strongest correlation (coefficient = 0.934783, R² = 0.837409), while Building #26 demonstrates a relatively lower but still significant relationship (coefficient = 0.853211, R² = 0.687994). This building-specific analysis provides valuable insights for targeted environmental interventions, supporting recent research on the importance of contextualized approaches to workplace environmental design. The variations in significant factors across buildings suggest that environmental optimization strategies should be tailored to the specific characteristics and requirements of each facility.
3.3. Visualization
We implemented an innovative survey mechanism capable of integrating spatial data, facilitating building-specific IEQ assessments. This visualization approach builds on recent advances in spatial data representation (Wang et al., 2019) and environmental quality mapping (Lee et al., 2020). As shown in Figure 1(a), the building footprint of the research complex is displayed with comprehensive spatial information, providing a clear overview of the facility layout and structure.
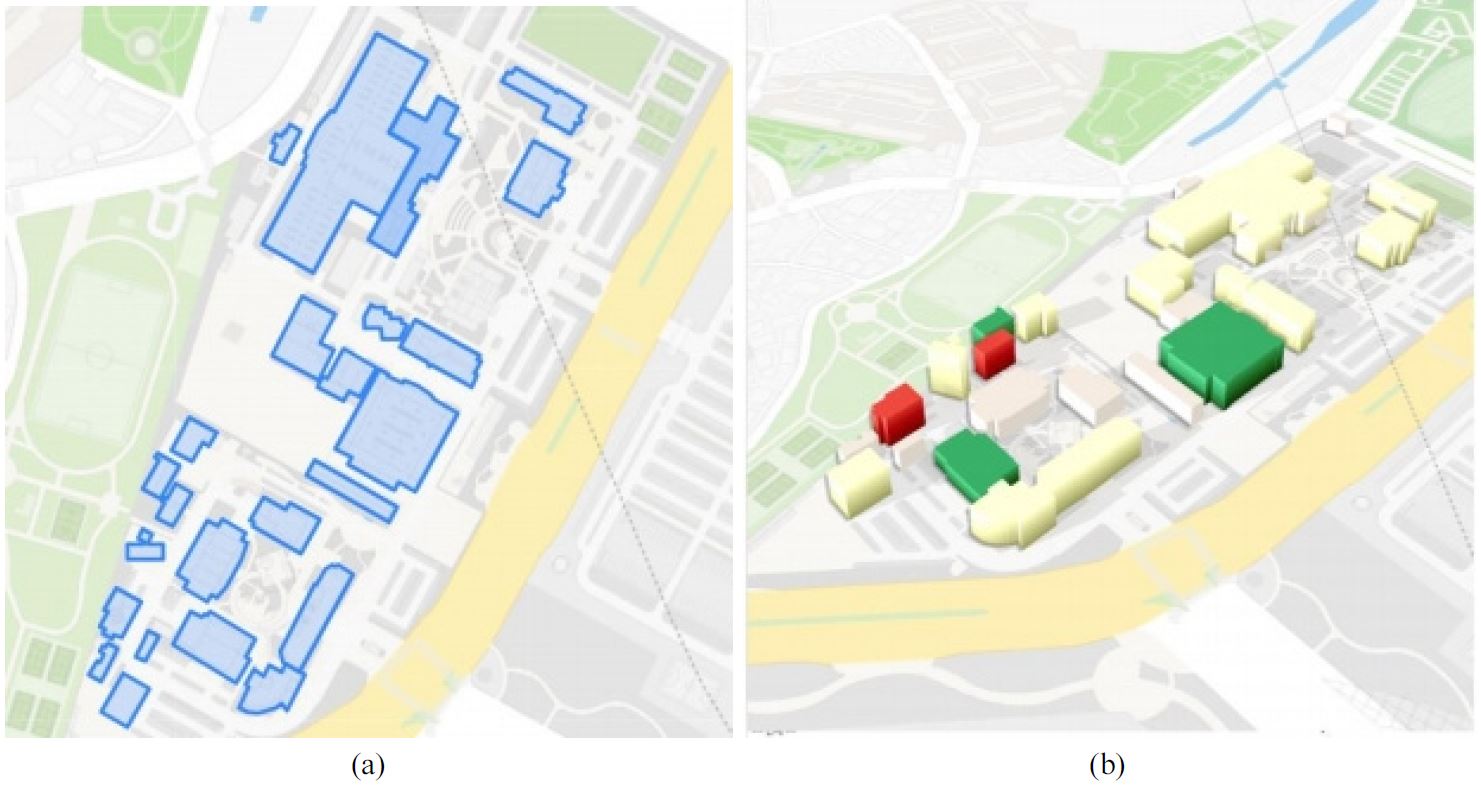
Figure 1.
(a) Building footprint of a research complex with spatial information (b) Visualization of IEQ assessment results for each building with spatial information and floors. Color scale represents satisfaction levels: Red (below median satisfaction, <2), Yellow (median satisfaction, 3-5), Green (above median satisfaction, >5).
The system’s visualization capabilities extend beyond simple mapping, incorporating advanced three-dimensional representation techniques. Figure 1(b) demonstrates our novel approach to visualizing IEQ assessment results for each building with integrated spatial information and floor-level detail. This visualization method encodes IEQ ratings into an intuitive visual spectrum, where each building’s assessment is comparatively color-mapped—green denoting above-median satisfaction levels and red indicating below-median. The color-coding scheme directly reflects our regression analysis results, with different shades representing the varying impacts of key IEQ factors across buildings. For instance, buildings showing stronger correlations between office layout and overall satisfaction (such as Building #1 with a coefficient of 0.602201) are represented in distinct color patterns, enabling quick visual identification of building-specific environmental characteristics.
Such visualization allows for a simultaneous, comprehensive evaluation of the research complex, providing an immediate, intuitive grasp of relative IEQ performance across different buildings. This integration of statistical results with spatial mapping enables facility managers and researchers to quickly identify patterns and prioritize interventions based on quantitative evidence. Furthermore, the color-coded visualization system, coupled with the regression analysis results, supports more efficient decision-making processes for environmental optimization by providing a clear visual representation of the statistical relationships identified in our analysis.
4. CONCLUSION
This research conducted a spatial analysis of IEQ satisfaction within a research complex, addressing a previously unexplored domain. A key contribution was the development of a comprehensive approach that derived weighting factors for both the entire complex and individual buildings, extending traditional environmental assessment methodologies. The study’s innovative survey system, which integrates location-based services with three-dimensional visualization capabilities, enables simultaneous feedback collection while providing new benchmarks for facility management.
Our findings revealed significant variations in IEQ factors across different buildings, demonstrating the importance of tailored environmental strategies. The strong correlation between overall comfort and productivity emphasizes the need for optimized indoor environmental conditions in research facilities. The color-coded visualization system provides facility managers with effective tools for identifying and addressing environmental concerns. This research establishes a framework for evaluating and optimizing IEQ in a research complex, with potential applications for future studies exploring building-specific environmental optimization strategies.
In addtion, the strong correlation between overall comfort and productivity (R² = 0.7668) was highlighted as a significant finding because it empirically validates the economic importance of IEQ optimization in research facilities. This relationship demonstrates that environmental investments directly impact work performance, with an 88.41% coefficient indicating that improvements in comfort conditions translate to substantial productivity gains. This finding provides facility managers with quantitative evidence to justify IEQ improvement initiatives and prioritize interventions that maximize both occupant satisfaction and organizational performance.
Despite its contributions, this study has several limitations. First, the research relied on subjective assessments through surveys rather than objective environmental measurements, which may introduce response biases. Second, the cross-sectional nature of the data collection limits our understanding of seasonal variations in IEQ perceptions. Third, the focus on a single research complex may limit generalizability to different geographical or organizational contexts. Future research should incorporate objective environmental measurements alongside subjective assessments, implement longitudinal data collection to capture seasonal variations, and expand the methodology to diverse research facilities across different regions. Additionally, exploring the economic implications of IEQ improvements through cost-benefit analyses would provide valuable insights for facility management decision-making.